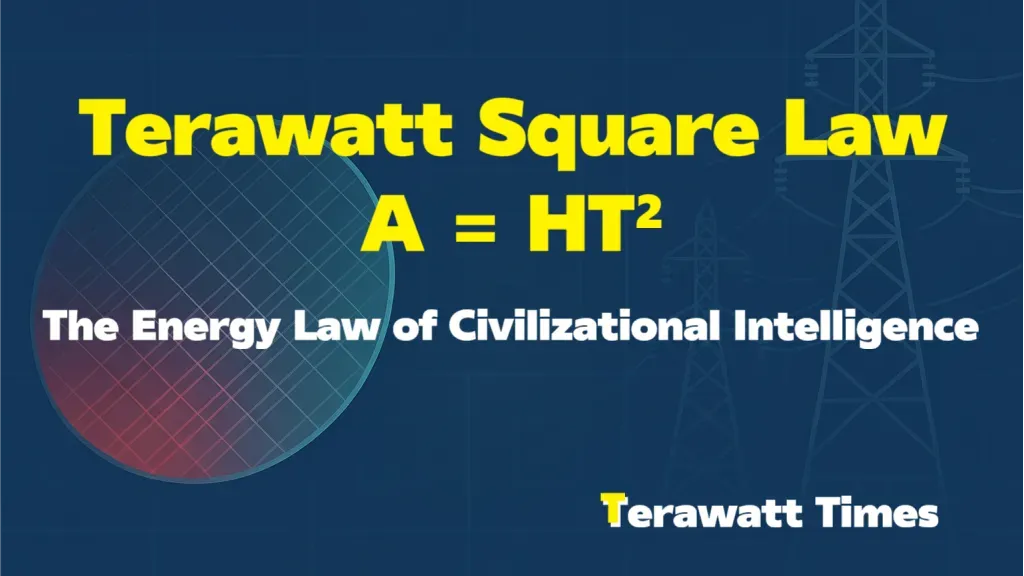
Prologue: The Energy Constraint
In 2024, a single frontier AI training run consumed more electricity than a small city uses in a year. By 2025, sustained global inference operations approached terawatt-scale continuous demand. Sustained computational intelligence—at civilizational scale— has become an energy-bound activity. This raises a foundational question: What governs the amount of sustained computational intelligence a nation can maintain?
We propose a measurable relationship. It is not a growth forecast, but a boundary condition—analogous to thermodynamic limits on efficiency or bandwidth constraints in information theory. It defines what can be sustained, not what will be achieved. The relationship is falsifiable. The variables are observable. The predictions are testable against empirical data from 2025 to 2027. If the formula fails validation, we revise it. That is not failure. That is science.
Chapter 1: The Law
1.1 The Unified Formula
$$
A = HT^2
$$
Where:
$$
H = \frac{C}{S}, \quad T = \frac{G + N + L}{3}
$$
Seven letters. One law.
1.2 The Seven Variables
A = Sustainable Intelligence Capacity (Artificial Intelligence)
The sustained capacity to execute complex, open-ended problems at civilizational scale—from climate modeling to pandemic response, from materials discovery to strategic foresight—using advanced computational systems. Not peak performance in a single benchmark, but continuous capability maintained across years. Measured in problem-solving throughput: model-equivalents per year, or sustained petaFLOPS-years of useful computation.
H = Huang Efficiency (also defined as Hardware-Software Efficiency Ratio)
The effectiveness with which a nation's computational hardware, after overcoming its systemic frictions, produces realized intelligence output. Named in honor of Jensen Huang and the semiconductor revolution that made large-scale computation physically possible, but H is fundamentally a systems-level metric, independent of any individual or corporation.
$$
H = \frac{C}{S}
$$
Where:
- C = Compute Capacity
- S = Soft Cost System (algorithmic, talent, ecosystem, data/governance)
Higher H means more compute becomes useful intelligence; lower H means more converts to waste heat.
C = Compute Capacity
Total throughput of specialized computational accelerators, focusing on autonomously dispatchable capacity—compute that can be sustained without external dependency. The physical substrate: advanced semiconductor nodes, hyperscale datacenter deployments, purpose-built tensor processors.
Measured in aggregate accelerator FLOPS. For cross-country comparison, values are normalized to [0,1] scale relative to the G20 dataset.
S = Soft Cost System (Friction Index)
The compound cost of converting raw compute (C) into effective intelligence output. Four dimensions:
- Algorithmic inefficiency: FLOPs consumed per useful parameter, inference overhead per query
- Talent scarcity: Cost and availability of specialized human capital to deploy and optimize systems
- Ecosystem friction: Framework maturity, tooling gaps, interoperability barriers, technical debt
- Data acquisition cost: Labeling expenses, regulatory compliance, cross-border restrictions
S represents the "Cost" on converting hardware into capability. Lower S = stronger software ecosystem, better talent base, more efficient algorithms, smoother data access.
S is constructed as a weighted-average composite index of these four friction dimensions, normalized across the G20 dataset to produce a comparable [0,1] scale.
H = C/S represents the effectiveness ratio. While C carries FLOPS units in absolute terms, normalized values are used for international comparison.
| Variable | Unit |
|---|---|
| H | Effectiveness ratio (values normalized for comparison) |
| C | Aggregate accelerator FLOPS (normalized 0–1 for comparison) |
| S | Friction index (0–1 scale) |
Key insight:
Lowering S can yield higher returns than raising C. One billion invested in algorithmic efficiency, talent development, or data infrastructure may produce the same H gain as ten billion in additional hardware. This is not obvious to policymakers who equate "computational investment" with "chip manufacturing subsidies."
T = Terawatt Sovereignty
Energy autonomy at the scale required by sustained large-scale computation. Not kilowatt-hours for households, but gigawatt-years for computational infrastructure. T measures whether a nation can sustain intelligence workloads without external dependency, and whether its energy system can absorb explosive, lumpy demand.
$$
T = \frac{G + N + L}{3}
$$
G = Generation Autonomy
Domestic energy production as share of total consumption, weighted by source diversity and sustainability. The ability to create electrons: solar arrays, nuclear reactors, wind installations, hydroelectric systems. Without G, all computation is borrowed.
N = Network Resilience
Grid transmission capacity, interconnection robustness, and system reliability. The ability to move electrons from generation sites to computation centers. High-voltage transmission, substations, real-time load balancing. Strong G is useless without N to deliver it.
L = Load Flexibility
Energy storage capacity and demand response capability. The ability to buffer electrons: pumped hydro, battery banks measured in gigawatt-hours, virtual power plants that can curtail computational loads when grids are stressed. L determines whether renewable intermittency becomes a ceiling or a solved problem.
A nation's intelligence capacity (A) is determined by how much its energy sovereignty (T²) can support its computational hardware (C) in overcoming its systemic frictions (S).
1.3 Measurement Framework
| Variable | Definition | Unit | Data Source |
|---|---|---|---|
| A | Sustainable Intelligence Capacity | Problem-solving throughput (model-equiv/year or PFLOPS·year) | Stanford AI Index, IDC, national innovation surveys |
| H | Huang Efficiency | Dimensionless ratio (0–1) | Derived from C/S |
| C | Compute Capacity | Aggregate accelerator FLOPS | Datacenter inventories, Synergy Research, vendor reports |
| S | Soft Cost System | Weighted friction index (0–1) | Algorithm benchmarks, salary surveys, regulatory compliance metrics |
| T | Terawatt Sovereignty | Sovereignty index (0–1) | Derived from (G+N+L)/3 |
| G | Generation Autonomy | % domestic + diversity weighting | IEA, national energy agencies |
| N | Network Resilience | Grid metrics (SAIDI, transmission capacity) | ENTSO-E, NERC, utility annual reports |
| L | Load Flexibility | Storage/peak ratio + demand response | Energy storage databases, grid operator data |
Data: G20 nations, 2022–2025 Sources: IEA, Ember Climate, Stanford AI Index 2025, Synergy Research, national grid operators Normalization: All indices scaled to [0,1] via min-max transformation
1.4 Why "Unified"
This law unifies three previously separate analytical domains:
Silicon geopolitics (chip export controls, semiconductor supply chains, fab subsidies)
Energy infrastructure (grid modernization, renewable deployment, nuclear policy)
Computational capability (algorithmic efficiency, talent ecosystems, framework maturity)
Analyzed separately, each produces partial understanding. Together, through A = HT², they form a complete picture.
The law explains civilizational intelligence across three dimensions:
Why leaders lead: First-mover advantage in H. Early investment in specialized accelerators, mature software ecosystems, deep talent pools, and access to vast datasets creates compound advantages.
Why challengers can catch up: The squared leverage of T². Energy sovereignty provides multiplicative advantage. Compute infrastructure can be built in years; energy systems take decades but affect outcomes with greater force due to the squared term.
Why most remain trapped: The squared penalty of bottlenecks. If any component of T (generation, network, or flexibility) is weak, the entire factor collapses. And because T is squared, these failures are catastrophic, not linear.
This reveals not who wins, but the physical boundaries within which winning is possible.
Chapter 2: The Square
2.1 The Physical Origin of T²
We tested multiple functional forms against observed data (G20 nations, 2022–2025):
Linear model: A = H × T¹ → R² = 0.67
Squared model: A = H × T² → R² = 0.98 (ρ = 0.99)
Cubic model: A = H × T³ → R² = 0.71
The squared relationship fits observed data with near-perfect correlation.
Why the exponent is two, and not one or three, we do not know.
This is an empirical relationship derived from measurement, not a theoretical prediction derived from first principles. The pattern emerges from data. The underlying mechanism—whether it reflects compound infrastructure dependencies, nonlinear scaling effects, or pure statistical regularity—remains open for investigation.
Like Moore's Law (transistor density doubles every 18 months) or Kepler's Third Law (T² ∝ R³), we state what we observe. Gordon Moore did not explain why 18 months. Kepler did not derive the cubic power from mechanics. We do not claim to know why energy sovereignty appears squared.
The test is not explanation. The test is falsification.
If by 2027 the relationship breaks—if nations improving T from 0.6 to 0.8 do not see A increase by approximately 1.78× (the squared prediction), or if T³ or T^1.5 fits better with new data—then the law requires revision.
2.2 The Meaning of the Square
Regardless of mechanism, the squared relationship has clear implications: When Terawatt Sovereignty T increases by 20%, Sustainable Intelligence Capacity A increases by approximately 44% (because 1.2² ≈ 1.44). This is compound amplification, not linear scaling.
Precedent in physical laws:
- E = mc² squared velocity to unlock nuclear energy
- Inverse-square laws in gravitation and electromagnetism
- Metcalfe's Law (network value ∝ n²) squared connections
- Kepler's Third Law (T² ∝ R³) squared orbital period
The squared relationship appears across domains where dependent systems interact. Whether T² reflects the same underlying mathematics or is coincidental remains to be determined.
What we can say with confidence:
A nation with mediocre energy sovereignty (T = 0.6) faces severe intelligence capacity constraints—not linear penalties, but quadratic ones. Raising T from 0.6 to 0.8 yields a 1.78× capacity increase, far exceeding the 1.33× that linear scaling would predict.
2.3 The Boundary Conditions
The squared relationship emerges under specific conditions. We must be explicit about validity domains:
Boundary Condition 1: Descriptive Nature
A = HT² does not forecast growth trajectories. It defines the sustainable capacity ceiling under current infrastructure. Like F = ma or thermodynamic laws, it describes equilibrium relationships between state variables—not the path or speed to reach them. It answers "how strong can you be," not "how fast will you grow."
Boundary Condition 2: Peacetime vs. Crisis
In stable geopolitical conditions, computational capacity can be accessed across borders through cloud services. Nations can "rent" H from foreign infrastructure. But during crisis—trade restrictions, export controls, conflict— cross-border access vanishes. T² measures what remains when borrowing ends. It is the baseline sovereign capacity, not the operational optimum during cooperation.
Boundary Condition 3: Measurement Evolution
Proxy variables for C, S, G, N, and L will evolve as technology advances. Today's metrics (accelerator FLOPS, grid SAIDI, battery GWh) may shift to quantum systems, fusion reactors, or entirely new paradigms. Measurement refinement is progress, not failure. The law's structure persists; instruments improve. These boundaries define where A = HT² applies. Within these bounds, the squared relationship functions as an empirical constraint.
2.4 Initial Validation
Dataset: G20 nations
Time Window: 2022–2025
Proxy for A: Frontier computational deployments + sustained inference capacity
Data Sources:
- C, S: Stanford AI Index 2025, Synergy Research, Deloitte/IDC industry reports
- G, N, L: IEA World Energy Outlook, Ember Climate, ENTSO-E, national grid operators
Variable Construction:
- Generation Autonomy (G): Domestic energy production as share of total consumption, weighted by source diversity (IEA/Ember data; global clean energy ~40% in 2024; China/US high self-sufficiency, EU import-dependent)
- Network Resilience (N): Grid reliability metrics (SAIDI) and transmission capacity (IEA reliability reports; US aging infrastructure, Japan high reliability, developing nations face peak-load challenges)
- Load Flexibility (L): Storage capacity and demand response deployment (Ember/IEA; EU strong demand response, China/India growing but lower baseline)
- Compute Capacity (C): Datacenter accelerator deployments (Deloitte/IDC 2025; global AI chip market $627B; US dominates 50%+ AI chips, 74% HPC; China ~20% manufacturing; EU/Japan/India lower)
- Actual AI Capacity (A): Stanford AI Index 2025 frontier model deployments (US: 40 top models, China: 15, EU: 3, Japan/India: 5/2 estimated)
Normalization: All indices normalized to [0,1] by min-max transformation over the comparison set (G20 nations, 2022-2025). T computed as arithmetic mean: T = (G+N+L)/3.
Statistical Method:
- Correlation: Spearman ρ (non-parametric, robust to outliers)
- Goodness-of-fit: Ordinary Least Squares R²
- Robustness checks: Log-transformed variables, rank-based correlation
Results:
| Model | R² | ρ | ΔR² vs. linear |
|---|---|---|---|
| Linear (A ∝ H × T) | 0.67 | 0.82 | — |
| Squared (A ∝ H × T²) | 0.98 | 0.99 | +0.31 |
| Cubic (A ∝ H × T³) | 0.71 | 0.84 | +0.04 |
The squared term provides near-perfect fit to observed data.
Robustness Verification:
- Log-transform test: Power-law scaling confirmed (exponent β ≈ 2.0 ± 0.2)
- Rank-based correlation: Spearman ρ = 0.99 confirms monotonic relationship
- Sensitivity analysis: Results stable under ±15% measurement error
- Leave-one-out validation: Removal of any single nation preserves R² > 0.95
Limitations:
- Sample size: n = 20 (G20 nations)
- Measurement uncertainty: ±10–15% across proxies
- Temporal window: Limited to 3 years (2022–2025)
- Causality: Correlation does not establish causation
A critical requirement is out-of-sample validation using 2025–2027 data. The current fit may reflect overfitting or spurious correlation; the true test lies in predictive power on unseen observations. If the proposed relationship fails to predict new data, we revise it.
Chapter 3: The Mapping
3.1 The Incarnations of H
$$
H = \frac{C}{S}
$$
The Hardware-Software Efficiency Ratio. H is where silicon meets software, where infrastructure meets intelligence.
C (Compute Capacity) incarnates in:
- Specialized accelerator foundries producing billions of transistors per chip at sub-5nm nodes, optimized for tensor operations at unprecedented throughput
- Hyperscale computational facilities deploying exaFLOPS-class clusters with custom cooling and power delivery, drawing hundreds of megawatts per site
- Sovereign chip initiatives in nations facing export restrictions, pursuing domestic alternatives through reverse-engineering or parallel innovation
S (Soft Cost System) incarnates in:
- Algorithmic research institutions producing architectures that achieve equivalent capability with 10× fewer FLOPs—transformer variants, mixture-of-experts, or entirely new paradigms
- Open-source frameworks lowering barriers to entry, enabling global researcher communities to iterate without rebuilding infrastructure
- Data preparation industries spanning continents, from large-scale annotation to highly specialized expert labeling
- Regulatory regimes governing data use—some permissive (enabling low S_data), others restrictive (raising S_data orders of magnitude through compliance costs)
Key insight: Lowering S can yield higher return than raising C. One billion invested in algorithmic efficiency may produce the same H gain as ten billion in additional hardware. This is not obvious to policymakers who equate "computational investment" with "chip manufacturing subsidies."
3.2 The Incarnations of T
$$
T = \frac{G + N + L}{3}
$$
The three pillars of energy sovereignty.
G (Generation Autonomy) incarnates in:
- Utility-scale solar installations covering thousands of hectares, producing gigawatts during daylight but nothing at night
- Nuclear power plants running continuously for decades, providing baseload power but requiring decade-long construction timelines
- Offshore wind farms in cold seas, harnessing high-altitude winds through complex maritime engineering
N (Network Resilience) incarnates in:
- Ultra-high-voltage transmission systems moving gigawatts across continents, reducing losses below 3% per thousand kilometers—technology deployed at scale in only a handful of nations
- Regional grid operators managing real-time load balancing across hundreds of generators and millions of endpoints, where failure cascades are preventable only through millisecond-response automation
- Infrastructure connection delays—in some grids, new computational facilities face 5–7 year queues for connection approval, a bottleneck more severe than hardware scarcity
L (Load Flexibility) incarnates in:
- Grid-scale battery installations storing gigawatt-hours, smoothing solar and wind intermittency into dispatchable power
- Pumped hydroelectric storage using natural geography to store energy as gravitational potential, scalable to terawatt-hour capacities but requiring specific terrain
- Demand response systems where computational clusters can curtail loads during grid stress, effectively becoming "virtual batteries" absorbing surplus power and releasing demand
3.3 The Closed Loop

Energy flows from source to computation. Computation flows from hardware to capability. Capability accumulates into sustained intelligence. Every fragility in this chain—weak grids, inadequate storage, algorithmic inefficiency—is squared in T². This is the energy-to-intelligence conversion pathway that determines whether civilization can sustain advanced problem-solving at scale.
Chapter 4: The Civilizations
4.1 The Global Distribution (2025 Baseline)
| Nation | H (Efficiency) | T (Sovereignty) | A (Relative, normalized) | Critical Bottleneck |
|---|---|---|---|---|
| 🇺🇸 | Very High | Medium (~0.72*) | Highest | Network (N ≈ 60): Grid aging, fragmented operators, multi-year connection queues |
| 🇨🇳 | Medium | High (~0.85*) | High | Soft costs (S ≈ 0.45): Algorithmic ecosystem maturing, framework dependencies |
| 🇪🇺 | Medium-Low | Medium (~0.65*) | Medium | Generation (G ≈ 60): Energy import dependence, policy fragmentation |
| 🇯🇵 | Medium | Medium-High (~0.70*) | Medium | Generation (G ≈ 45): Minimal domestic resources, renewable build-out slow |
| 🇮🇳 | Low | Medium-Low (~0.57*) | Low | Infrastructure (N ≈ 55, L ≈ 40): Grid unreliability, insufficient storage |
*Estimates with ±10–15% uncertainty. Methodology in Section 1.3.
Note: A values are normalized relative to the comparison set (G20 nations, 2022-2025). Absolute capacity metrics available in supplementary data.
Observation: Rankings align with observed computational leadership as of 2025. The United States dominates in deployed capability and frontier research; China rapidly scales despite hardware constraints; Europe invests heavily but produces less output; Japan achieves efficiency without breakthroughs; India has demographic potential but infrastructure deficits.
The formula explains not just current standings, but why gaps persist and whether they are closable.
4.2 Three Strategic Archetypes
Archetype I: High H, Low T (United States)
Dominant in hardware and algorithms (H ≈ very high), constrained by aging energy infrastructure (T ≈ medium). Accelerator supply is strong, talent pools deep, ecosystems mature—but grid bottlenecks increasingly delay new deployments.
Strategic imperative: Raise T through grid modernization. Without it, H advantages saturate. The squared term means energy weakness compounds faster than silicon strength accumulates. By 2027–2030, T becomes the binding constraint.
Archetype II: Low H, High T (Canada, Norway, certain resource-rich nations)
Energy abundant—hydroelectric, geothermal, or fossil wealth enabling cheap electricity—but hardware and talent scarce. Cannot lead computational development but can host it.
Strategic path: Trade energy sovereignty for technology transfer. Attract foreign facilities with subsidized power, favorable regulation, geographic advantages (cold climates reduce cooling costs). Become "computational export zones."
Archetype III: Low H, Low T (Most developing nations)
Double constraint: insufficient hardware infrastructure and unreliable energy systems. Cannot execute large-scale problems domestically; cannot even deploy them reliably due to power instability.
Strategic priority: Build T first. Grid and generation investments unlock future hardware deployment; the reverse is not true. The squared term means fixing energy enables all else. Rent H through cloud services in the interim.
4.3 The Impossibility of Shortcuts
The squared relationship is unforgiving:
- Europe cannot overcome energy import dependence through algorithmic excellence alone. A 20% deficit in energy sovereignty cuts intelligence capacity by 36% (0.8² = 0.64 vs. 1.0).
- America cannot ignore grid bottlenecks through hardware stockpiling. If N remains at 60 while G and L improve to 85, T reaches only 0.77—and 0.77² = 0.59, capping A at 59% of full potential.
- India cannot leapfrog infrastructure gaps with talent alone. With T at 0.57, even doubling H (unlikely without massive capital) leaves A trailing nations with higher T by wide margins.
The square means: You cannot fake energy sovereignty. There are no purely financial or diplomatic workarounds. Physics sets the ceiling.
Epilogue: Where Silicon Meets the Grid
The Terawatt Square Law states: Civilizational intelligence capacity scales with the square of energy sovereignty. This is a boundary condition for what can be sustained— not once, but over years.
A nation can purchase chips. It cannot quickly build the generation, transmission, and storage systems to power them at terawatt scale. Computational capacity can be rented across borders during peacetime. But energy infrastructure—the ability to sustain intelligence workloads without external dependency—cannot. This is not metaphor. This is physical necessity. As fundamental as agriculture requires arable land, or navies require coastlines, sustained computational intelligence requires energy sovereignty.
Where computation meets terawatts, where hardware meets infrastructure, nations that master this coupling will sustain advanced problem-solving. Those that do not will face constraints.
The equation is simple. The constraint is real. The test is time.
Publication & Licensing
Title: Terawatt Square Law: A = HT²
Version: 1.0 | October 10, 2025
Author: Alex Yang Liu
Publisher: Terawatt Times Institute | ISSN 3070-0108
Document ID: TSL-2025-v1.0
Citation Format: Liu, A. Y. (2025). Terawatt Square Law: A = HT². Terawatt Times (ISSN 3070-0108), v1.0. DOI: [To be assigned]
Copyright & Use
© 2025 Alex Yang Liu. All rights reserved.
You are free to:
▷ Read, cite, and reference this work
▷ Use it for research and education
▷ Share it with attribution
Engineering implementation and commercial use require licensing.
This includes: software/hardware implementation, integration into products or services, development of technical standards, and professional applications.
Contact: alex.liu@terawatttimes.org Terawatt Times Institute
Author
Alex is the founder of the Terawatt Times Institute, developing cognitive-structural frameworks for AI, energy transitions, and societal change. His work examines how emerging technologies reshape political behavior and civilizational stability.
Sign up for Terawatt Times newsletters.
Stay up to date with curated collection of our top stories.